In in previous post, I wrote about Matplotlib as a must have tool on your system to do interactive data visualization in an instant.
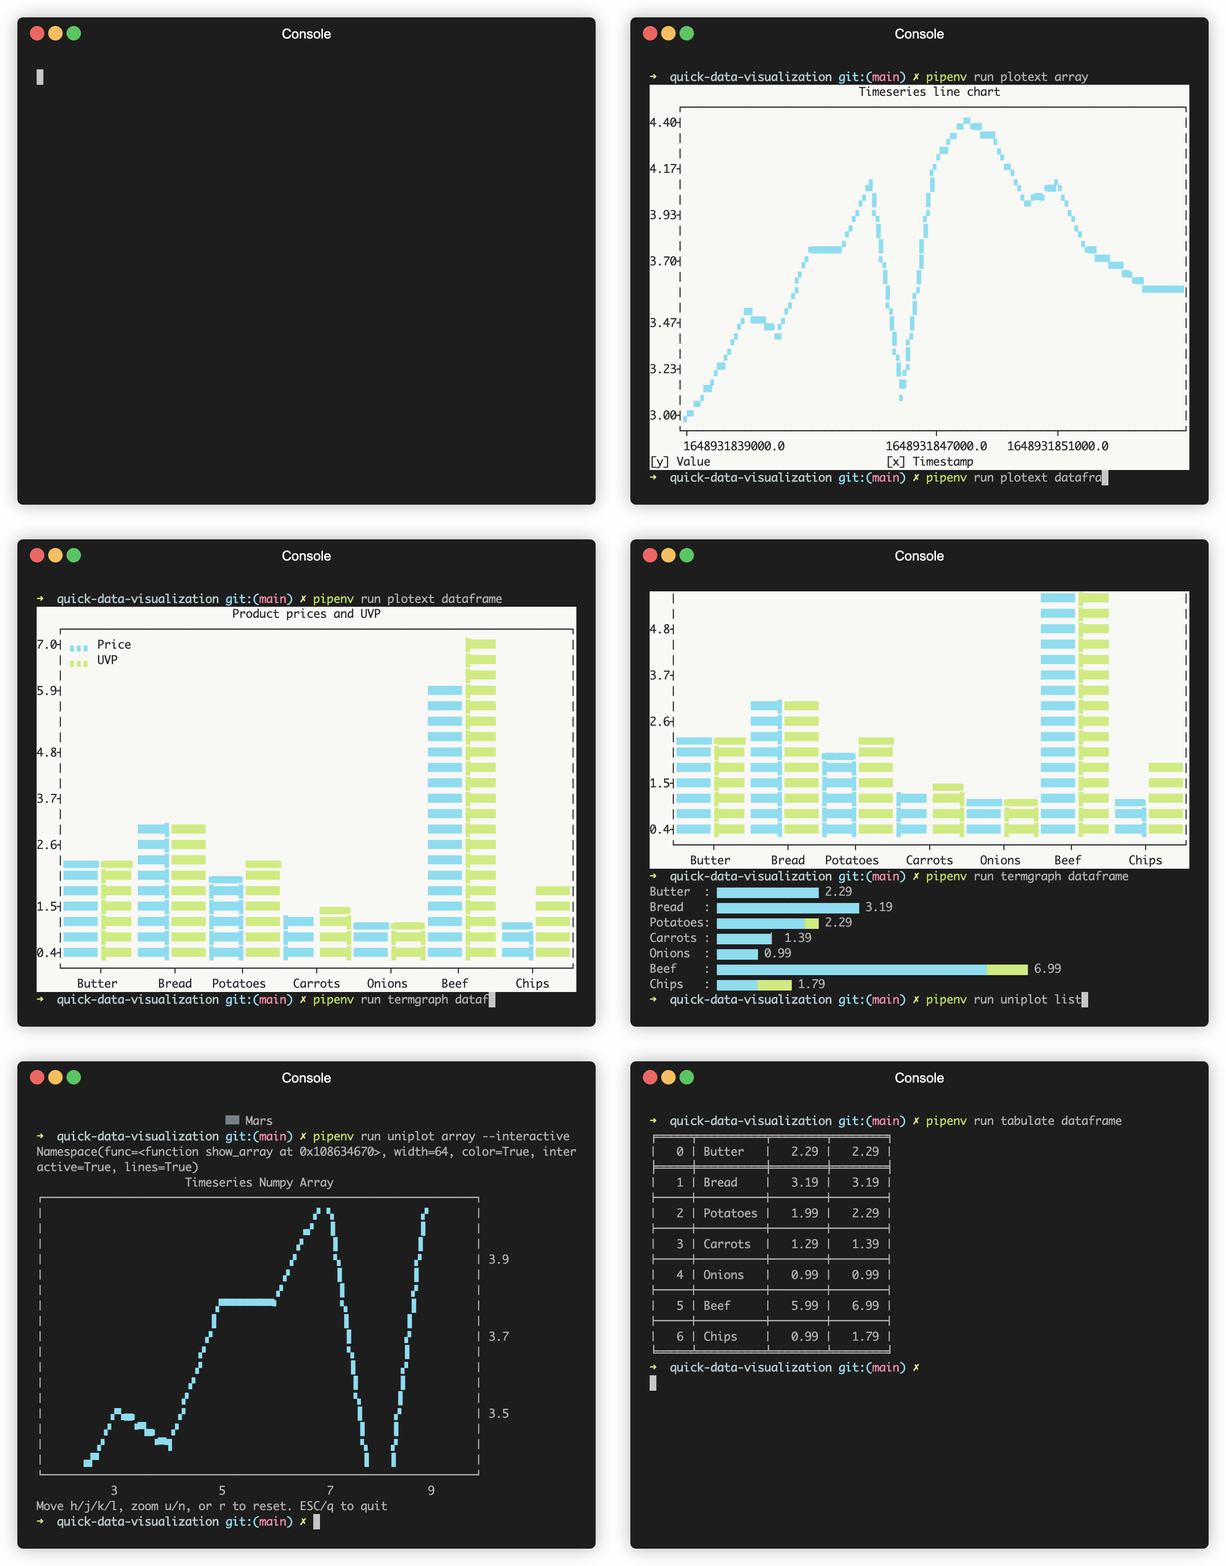
Today, I worked on a playground project called b3nk4n/quick-data-visualization where I started to collect and compare a few Python plotting libraries using a small set of data, such a nested Python list, a time-series in form of a NumPy array and a Pandas dataframe.
At least the following plotting libraries are covered:
UI-based
Text-based
To give you an idea, the following recording should serve as an example.
 Python quick data visualization in action
Personally, I sill prefer Matplotlib over Plotly, mainly because it opens in a window instead of in a web browser by default. However, Plotly’s interactivity is definitly more powerful compared to Matplotlib, by offering features such as mouse-over overlays. I really hope that some of these concepts end up in Matplotlib one day.
Regarding the text-based libraries, I really like Plotext because it almost works as a drop-in replacement for Matplotlib due to the use of a very similar API. I’m very sure this was not by accident.