At Instana, we use Apache Kafka as our distributed event streaming platform. Due to the growing adoption of the product, the amount of data flowing through our Kafka brokers more than doubled compared to last year. Exceeding 12 GB/s ingress across five production regions on AWS and GCP.
As part of the investigation about bad latency of individual consumers, I had to dive deep into the topic of Kafka performance optimization and how Kafka achieves its performance. And after we could correlate the bad latency and growing message lag to spikes in the read utilization of the underlying disks, we especially focused on how Kafka utilizes the disks and memory. And one interesting learning of this journey was how Kafka takes advantage of the OS page cache.
What is the OS page cache?
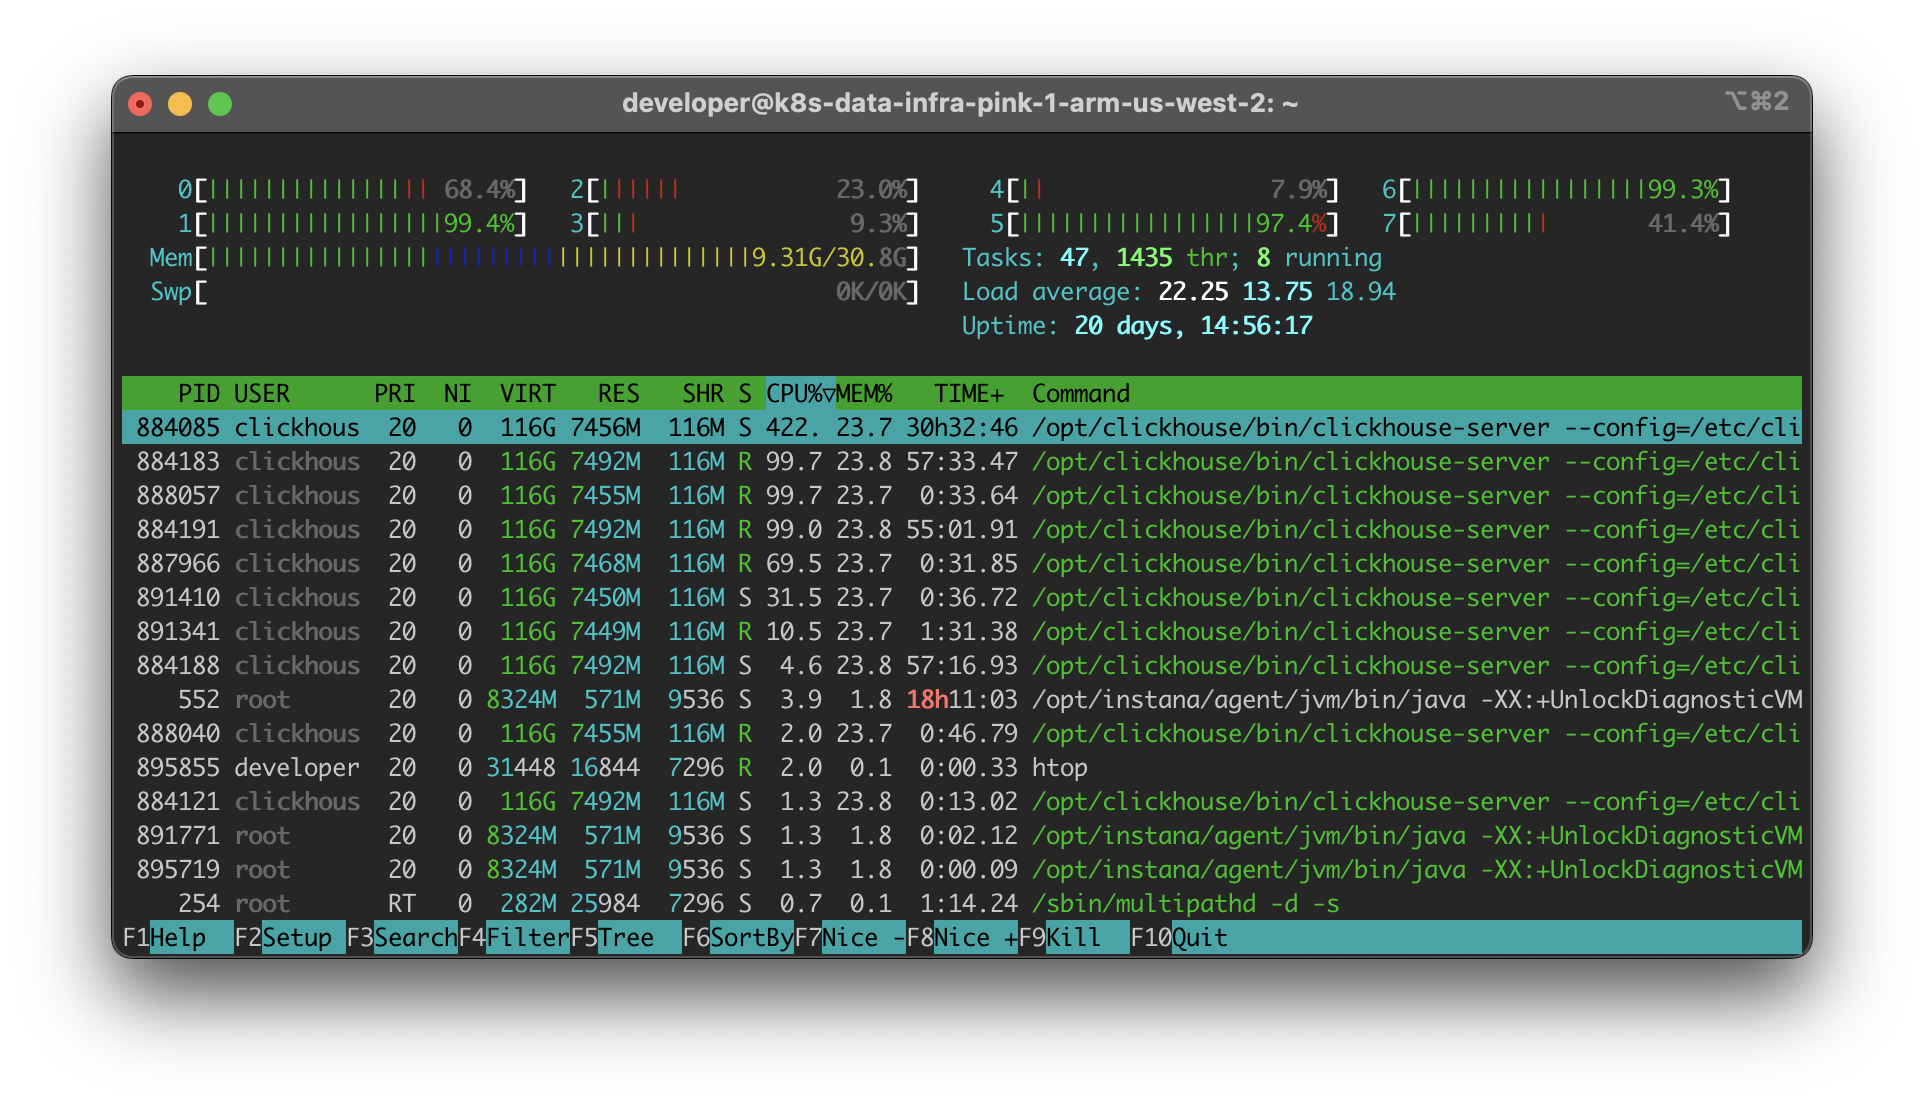
The page cache of the operating system is a transparent caching layer for the pages from the secondary storage devices (SSD, HDD). Unused main memory is used as a cache for pages to allow faster access and overall performance improvements. This caching layer is so transparent that even most Software Engineers don’t now about it. And you don’t even see it when you check you memory usage of your host, such as via htop:
 Memory usage using htop: Actually more than 9.31GB of memory are in active use
The shown memory usage is only representing the proportion of memory utilized by processes. However, it does not include the amount of memory transparently used for the OS page cache. On Linux, you can show the overall memory usage using the command free -m:
1
2
3
4
$ free -m
               total        used        free      shared  buff/cache   available
Mem:           31496        9794        1002           0       20699       21382
Swap:              0           0           0
This tells us that:
- From the total 32GB of memory, only about 1GB is unused (free).
- The operating system is using about 20GB of main memory as page cache (buff/cache).
- We are not using any swap memory, which is generally disabled on this system.
Are swap memory and page cache the same thing?
While both have in common that they relate to memory management, the swap memory is a dedicated portion of a hard disk used to store inactive data from main memory when it is full. Essentially extending the available memory. In contrast, the page cache is a part of the main memory where frequently accessed file data is stored temporarily to improve performance by reducing disk reads. In other words, swap memory is used when the RAM is full, or when pages are stale, such as due to inactive processes 1. Whereas the page cache is used to speed up access to frequently used files from the disk.
What did we learn?
When using Kafka at scale, memory really matters. And that is true even when your monitoring tool of choice might tell you that memory utilization is low. From my experience, when working in context of a high throughput application, it is also important to keep an eye on the read utilization of the underlying disk. Ideally, you will never read from disk, unless you are restarting any of the consumers that need to catch up. Otherwise, a many reads to the disk might indicate some sort of problem, such as that a consumer is continuously lagging behind. Which might be either because your consumer cluster is under-scaled, or because your Kafka nodes are overloaded. In case it is the latter, it is worth checking whether there is an imbalance within your Kafka cluster, such as by checking the partition assignment using:
1
 $ /opt/kafka/bin/kafka-topics --describe --topic <topic-name> --bootstrap-server localhost:9092
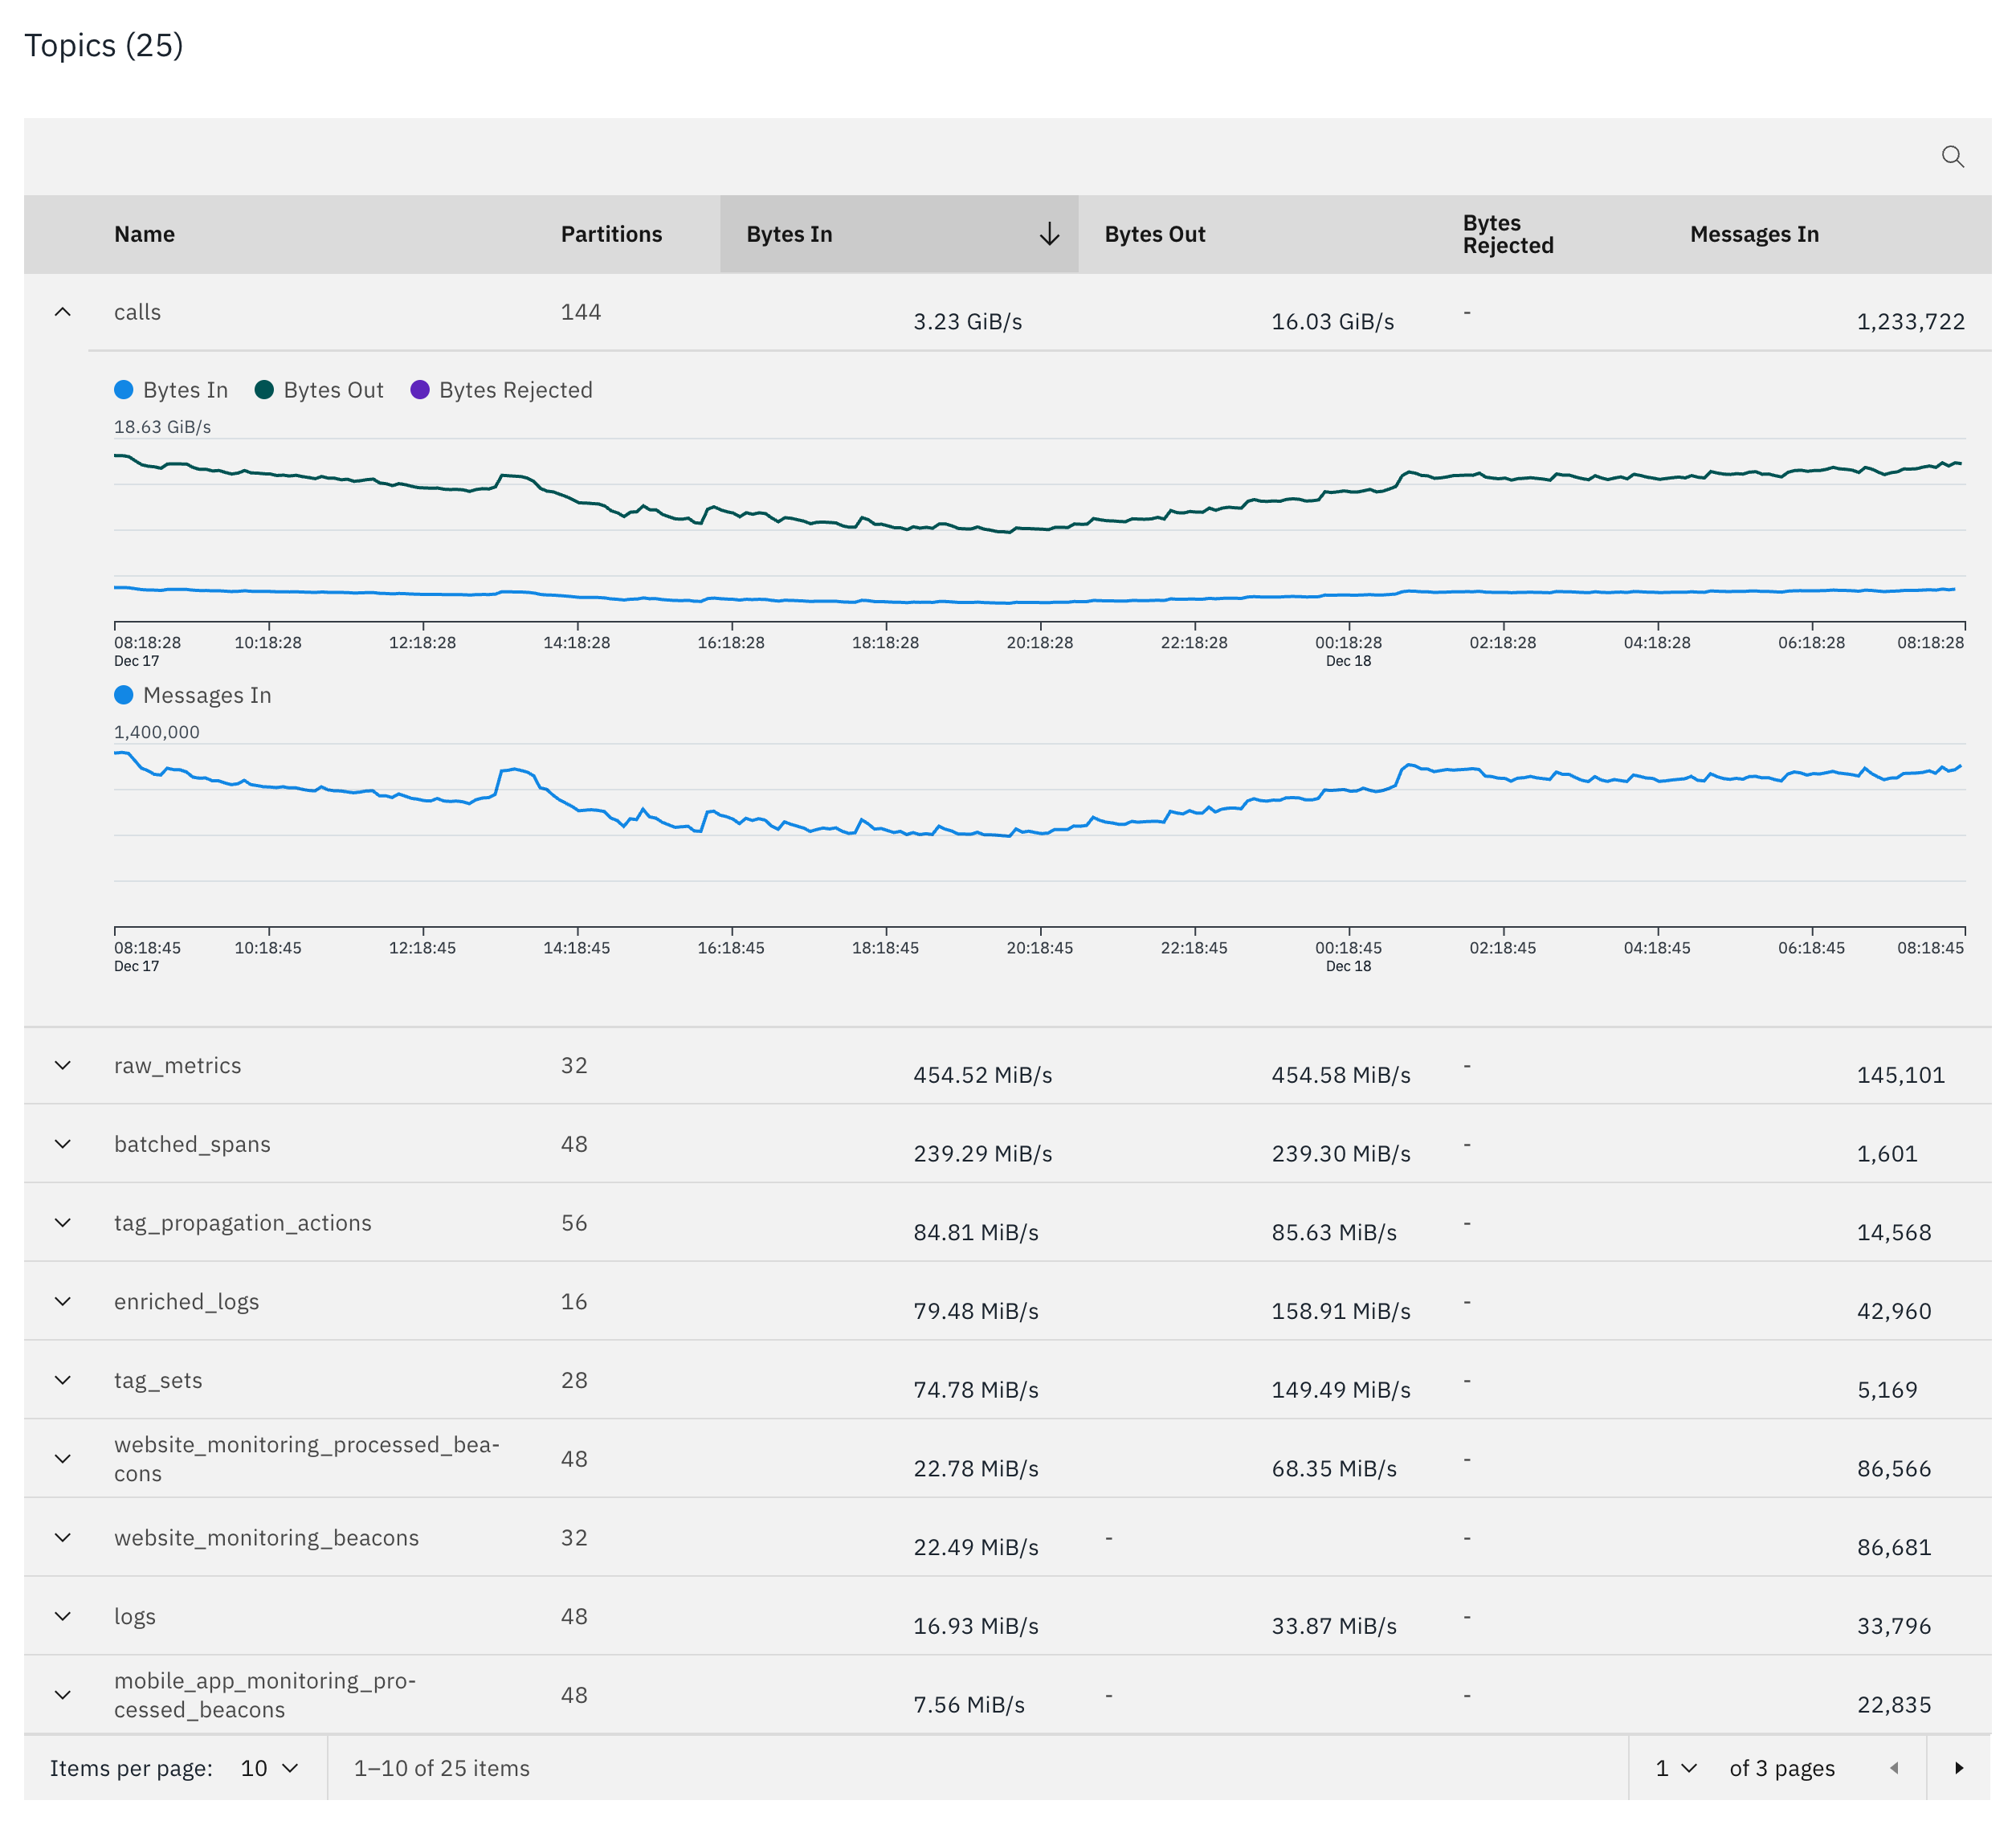
In some cases, manually triggering leader election or to reblanace the cluster might already do the job. However, if you have a dominating topic which has a significantly higher throughput compared to other topics, then it will make sense to ensure that the partitions of that topic are equally balanced across the Kafka cluster.
 Instana dashboard widget of a Kafka Cluster showing a dominating topic
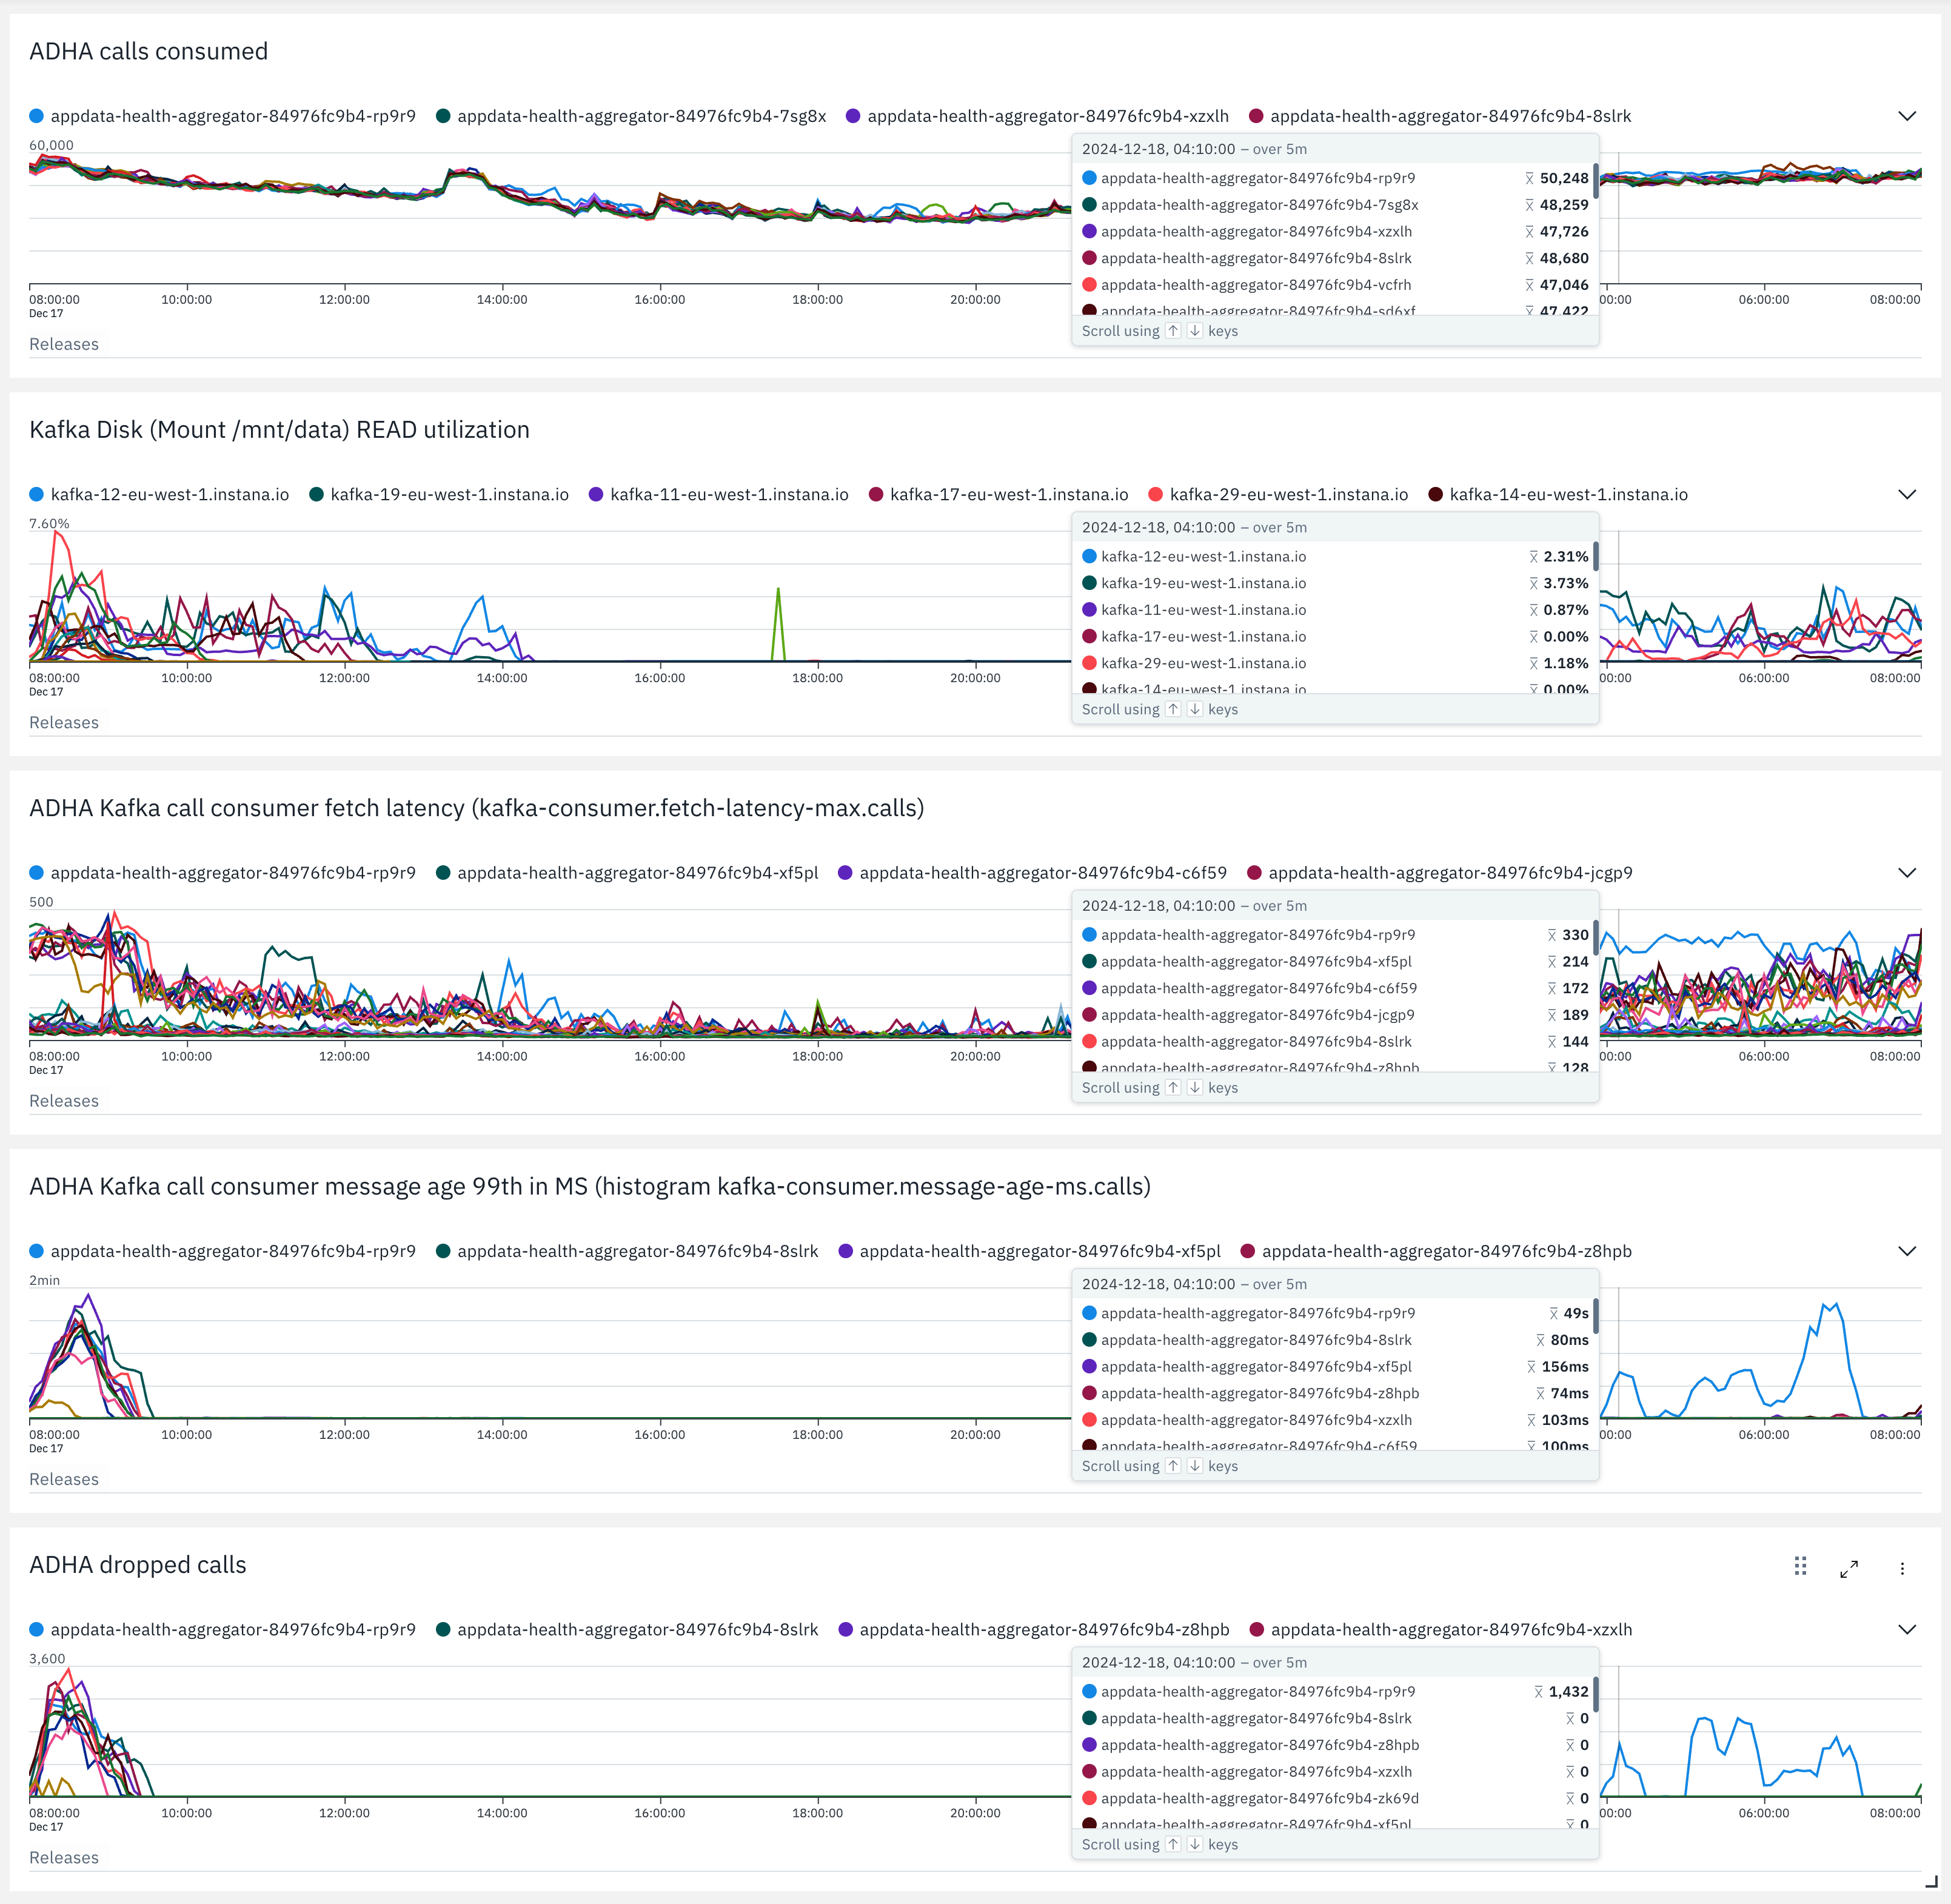
Otherwise, correlating metrics of the Kafka broker’s disks with metrics in the consumers might also reveal interesting patters.
 Instana custom dashboard widgets of metrics about disk read utilization in the Kafka nodes, and the consuming stream processor
Once you see disk reads, such as in the image above during peak hours, you might be able to correlate this to a degradation in the fetch-latency of your consumers. This increase in latency can cause message lag, which might lead to dropping in your stream processors to catch up, in case this situation is handled the same way as when having to drop data due to backpressure. All of this is under the assumption that your problem domain allows you to drop data. Otherwise, (auto) scaling the consumers, such as using KEDA, would be an alternative way of handling this situation.
Lastly, it is good to be aware that an under-scaled consumer of a topic can have a negative impact on the overall Kafka cluster. If consumers of a specific Kafka topic are continuously lagging behind, that means the likelihood that the request needs to be served from disk is higher compared to when fetching more recent data. Of course, all of that depends on your configured Kafka topic configuration, such as via log.retention.ms or log.retention.bytes, and the throughput of data in contrast to the available page cache.
How are the topic partitions of a Kafka log utilizing the page cache?
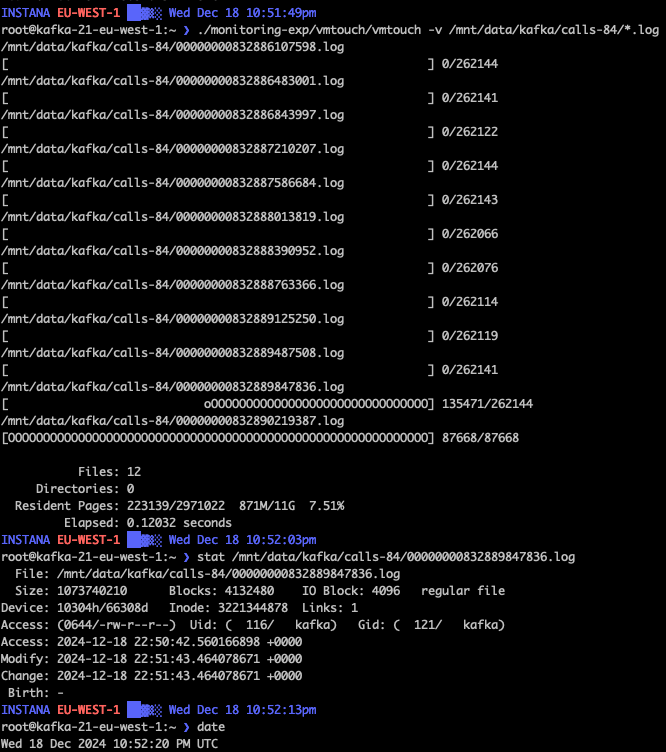
On our journey of tweaking our Kafka cluster and resolving performance bottlenecks, one tool that came in handy was vmtouch. The Virtual Memory Toucher is a tool for peeking into the file system cache of unix and unix-like systems.
Using that tool, we could get a better idea how much of the Kafka message log could be served from page cache. Furthermore, we could get a better idea about how much consumer lag could be served from memory due to the page cache. And about what consumer lag is more likely serviced from disk and explain the high read utilization we have been seeing.
 Using vmtouch to show details about the page cache usage of a single Kafka partition
Conclusion
Understanding the page cache is fundamental when working with Kafka, because it’s one of the main aspects which makes it so far. Furthermore, when operating Kafka at scale, it is important to also keep an eye on the disk utilization, beside just CPU and memory. Especially the read utilization of your disks. And don’t get fooled if your memory only seems to be utilized by less than 50%. The number you are looking at is very likely not incorporating the page cache. Ideally, use your observability tool of choice, and if not done already out-of-the-box, define an appropriate alert to uncover this situation proactively.
Related to Kafka, see the section about
vm.swappinessin this post or in Tuning Virtual Memory. ↩